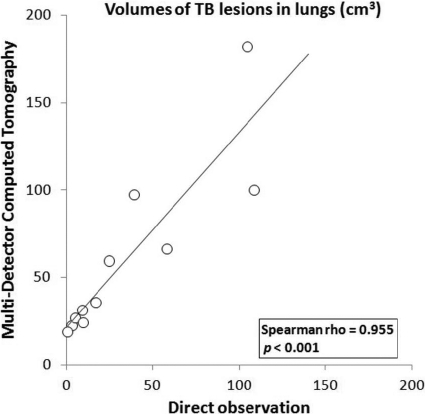
Fig. 4.
Correlation between the volumes of lesions in lungs measured by two quantitative methods. Visible lesions in lungs were calculated by MDCT and by image analysis of photographs of lung sections (direct observation) in infected goats (n = 11). Statistical analysis was conducted with a nonparametric Spearman rank test.

