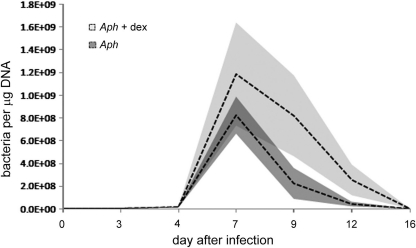
Fig. 1.
Anaplasma phagocytophilum peripheral blood load, as determined by quantitative PCR and normalized to total-blood DNA content in untreated and dexamethasone-treated horses. The dashed lines represent the mean values at each time point; the shaded areas delineate the standard error of the mean (SEM) for the means for each group. Although bacterial loads did not differ between the groups at individual days postinfection, the overall bacterial load (area under the curve) was significantly higher for dexamethasone-treated than for untreated A. phagocytophilum-infected horses (P = 0.022, χ2 test).

