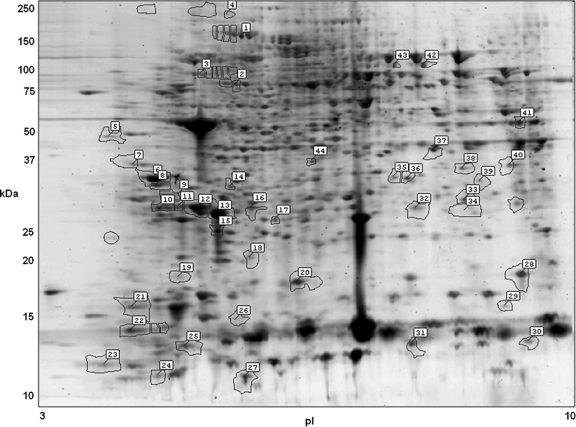
Fig. 1.
Two-dimensional gel image of the eosinophils from a patient with Fasciola hepatica infection and hypereosinophilia, stained with Sypro Ruby fluorescent stain. Highlighted protein spots indicate proteins whose levels differed by at least 2-fold between the Fasciola patient and healthy controls. The spot numbers accompanying the highlighted proteins are the pick numbers in Table 1.

