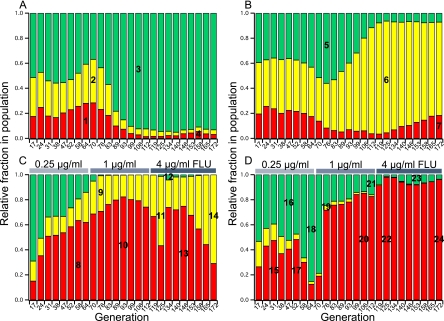
Fig. 1.
Evolutionary dynamics of experimental populations evolved either in the absence (CP-1 population [A] and CP-2 population [B]) or presence (DP-1 population [C] and DP-2 population [D]) of fluconazole. The colored bars represent the relative fractions of each colored subpopulation, RFP (red), GFP (green), and YFP (yellow), as determined using fluorescence-activated cell sorting (FACS). FLU, concentration of fluconazole in the feed. The subpopulations from which the adaptive mutants were isolated are numbered (details are in Table 1).

