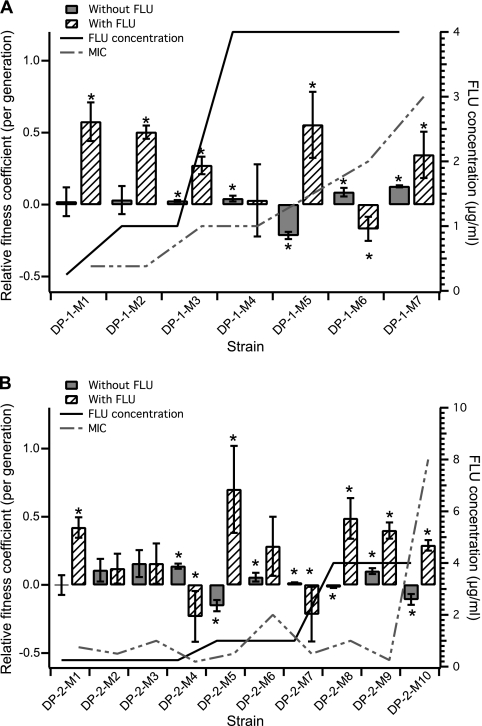
Fig. 2.
Relative fitness coefficients of adaptive mutants isolated from the fluconazole-exposed populations compared with the previous adaptive mutant, DP-1 (A) and DP-2 (B), in the presence of fluconazole (hatched bars), measured at the drug concentration indicated by the solid line, or without fluconazole (solid bars). The data shown are the averages and standard deviations (SD) of a minimum of 3 biological replicates. The asterisks indicate that the relative fitness difference measured in the adaptive strains is statistically significant (P < 0.05, using an unpaired Student t test with unequal variance). The dashed line indicates the measured MIC of each adaptive mutant.

