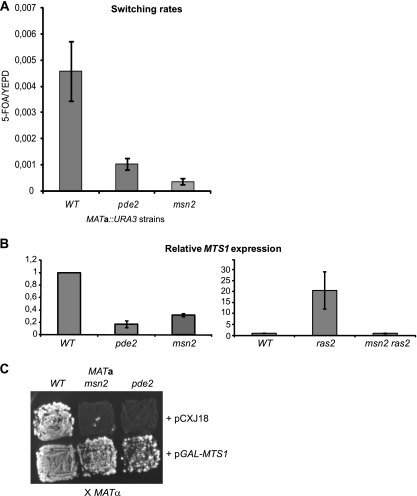
Fig. 3.
ras2, pde2, and msn2 mutations affected MTS1 transcription. (A) The ratios of 5-FOA/YEPD plating efficiencies were determined in strains SAY1488 (MATa::URA3), SAY1546 (MATa::URA3 pde2Δ::NAT), and SAY1539 (MATa::URA3 msn2Δ::kanMX) to determine switching rates. Error bars represent the standard errors from the means calculated from 11 (SAY1488), 7 (SAY1546), and 6 (SAY1539) independent experiments, respectively. (B) RT-qPCR analysis using primers specifically amplifying the MTS1 cDNA. The y axes show relative expression levels of MTS1 mRNA. In the left panel, mRNA was prepared from strains SAY1488 (WT), SAY1546 (pde2Δ::NAT), and SAY1539 (msn2Δ::kanMX). In the right panel, mRNA was prepared from SAY990 (WT), SAY1069 (ras2::pLEU2), and SAY1664 (msn2Δ::kanMX ras2::pLEU2). The level of expression in the wild-type strains was set to 1.0. The data were normalized to the expression of the ACT1 gene using the comparative threshold cycle (CT) method. Error bars indicate the maximum and minimum values obtained in two separate experiments. (C) Mating tests of the MATa strains WT (SAY572), msn2Δ::kanMX (SAY1379), and pde2Δ::NAT (SAY1131) to the MATα tester strain (WM52). Diploids were selected on SC-Ade-Lys.

