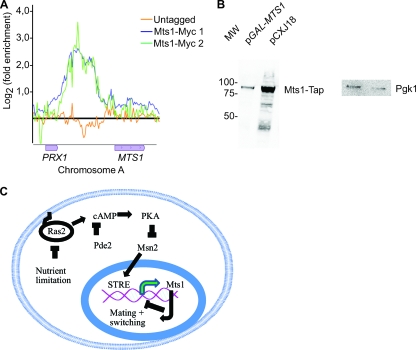
Fig. 4.
Negative autoregulation by Mts1 and preliminary model for regulation of switching. (A) An MTS1-Myc strain was subjected to ChIP-on-chip analysis (9) and analyzed using MochiView software (30). The x axis shows log2 (fold enrichment) ratios of two independent Mts1-Myc ChIPs to the input (green and blue lines) and an untagged strain (orange line). The genomic location is shown on the y axis. (B) Protein blot analysis of protein extracts from strain SAY988 (MTS1-TAP) containing plasmid alone (pCXJ18) or pGAL-MTS1 (pPMB35) using an anti-TAP antiserum. The right panel shows the same membrane using an anti-Pgk1 antiserum. (C) Schematic model for regulation of switching in K. lactis. PKA, protein kinase A; STRE, stress response element.

