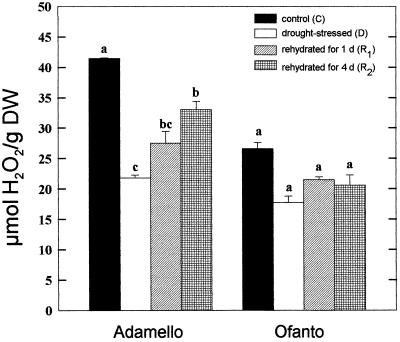
Figure 2.
Effects of dehydration and rehydration on hydrogen peroxide content in the wheat cvs Adamello and Ofanto. Bars represent the se (n = 10 repetitions from three independent experiments). One-way analysis of variance was used for comparisons between the means. Bars with different letters are significantly different at P ≤ 0.01.

