Fig. 7.
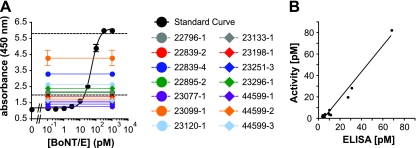
BoNT/E concentration correlates with toxin activity in avian blood samples. (A) BoNT/E protein concentration was measured by sandwich ELISA as described in Materials and Methods. Avian blood samples (colored circles) were compared to a standard curve of BoNT/E at the indicated concentrations (black circles). LOQs are indicated with dashed lines. (B) Avian blood samples containing BoNT/E protein concentrations within the LOQ as determined by sandwich ELISA (A) were plotted against BoNT/E activity measurements as determined by the BoTest Matrix E assay (Fig. 6). The slope of the linear regression was 1.224 ± 0.07 (R2 = 0.972).

