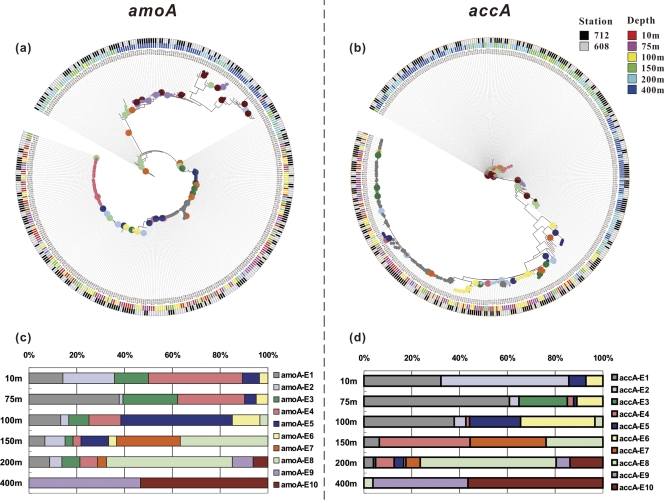
Fig. 6.
Ecotype simulation of crenarchaeal amoA (a) and accA (b) gene sequences recovered from the ECS and shift in relative abundances of different predicted ecotypes for amoA (c) and accA (d) across the water column of the ECS. Sampling stations and sampling depths are coded by colored squares. Predicted ecotypes are coded by colored circles at the phylogenetic nodes or the colored squares shown in panels c and d. Two more-detailed images for panels a and b are shown in Fig. S3 in the supplemental material.

