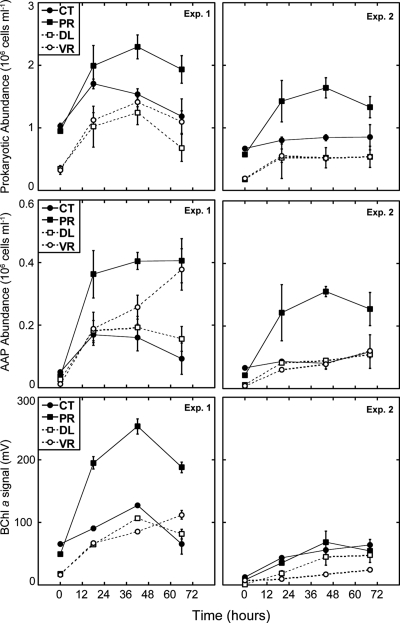
Fig. 1.
Changes in abundances of total prokaryotes (top), aerobic anoxygenic phototrophic (AAP) bacteria (middle), and bacteriochlorophyll a signals (lower) during incubations in the two experiments. CT, control; PR, predator reduced; DL, diluted; VR, virus reduced. Data shown represent averages ± standard deviations for two replicated bottles.

