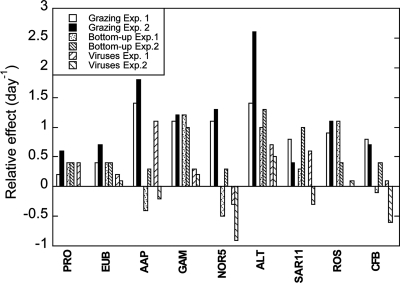
Fig. 5.
Relative effects of top-down and bottom-up controls on the growth rates of the different groups. Differences in growth rates (day−1) between control (CT) and predator-reduced (PR) treatments indicate the effects of grazing, those between diluted (DL) and predator-reduced treatments indicate bottom-up control, and those between virus-reduced (VR) and diluted treatments indicate the effect of viruses. See Materials and Methods for details.

