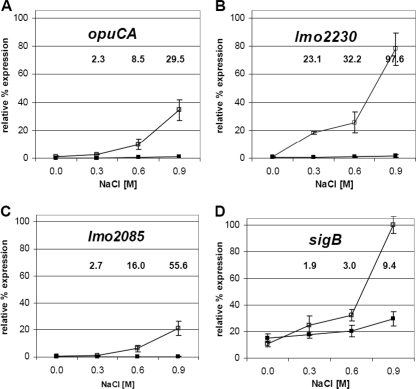
Fig. 2.
Osmotic activation of σB is proportional to the magnitude of the stress. Relative transcript levels of three σB-dependent genes (opuCA, lmo2230, and lmo2085) and sigB in the wild type (open symbols) and the ΔsigB mutant (closed symbols) grown in BHI broth at 37°C to the exponential phase (OD600 of 0.6) under a range of NaCl concentrations (0 M, 0.3 M, 0.6 M, or 0.9 M) are shown. RNA extracts and cDNA were prepared as previously described (25). All transcript levels were first normalized as described in Fig. 1 and then expressed as a percentage of the maximal level of sigB transcript detected in the experiment (thereby allowing the relative transcript levels of the 4 genes to be compared). The values presented on the graphs represent the means of the results of three independent experiments, and error bars indicate the standard deviations (n = 3). Numbers shown above the graphs indicate statistically significant differences in relative gene expression levels (severalfold change) between the results seen under stressed (0.3, 0.6, or 0.9 M NaCl added at each time point) and nonstressed (0 M NaCl) conditions (P < 0.05 by Student's t test).

