
Fig. 1.
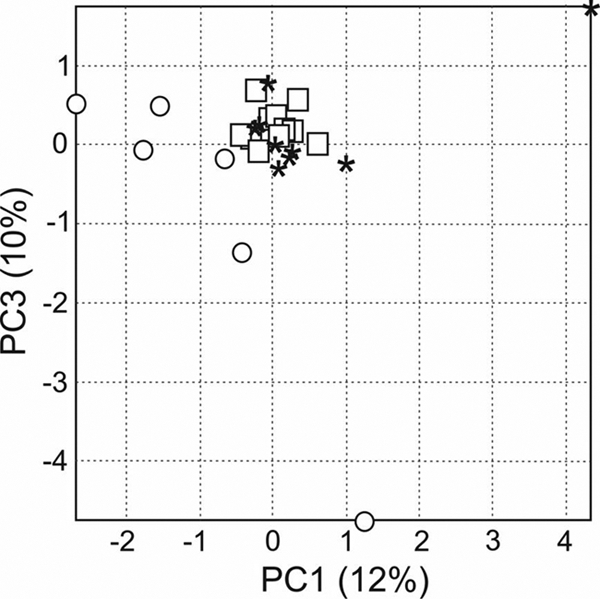
Correlations between the T-RFLP profiles obtained from the ileal samples mapped onto the first and third principal components of PCA. Healthy rats are indicated with circles. Diseased rats are indicated with asterisks (placebo-treated animals) or squares (probiotic-treated animals).