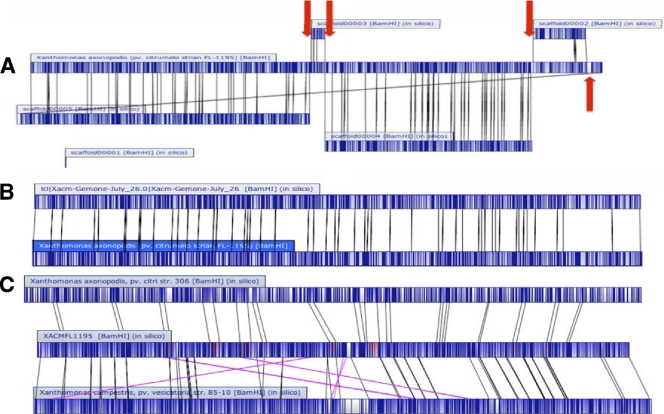
Fig. 1.
Alignments between the whole-genome optical maps and the in silico genome sequence assemblies at various stages of the project. Dark blue represents cut sites, light blue regions indicate alignment, and white regions indicate no alignment. (A) Early comparison of an optical map derived from BamHI digestion of the X. axonopodis pv. citrumelo F1 genome to the assembled scaffolds generated by sequencing. The X. axonopodis pv. citrumelo optical map derived from BamHI digestion of the chromosome is presented as a single contig in the center. The sequenced genome contains five scaffolds that have a corresponding match to the optical map. Scaffold 1 is too small to be mapped using current optical map technology. However, during gap closure it was placed between contigs 3 and 4. The finishing strategy including gap closure was simplified using the optical map as an assembly model. Red arrows indicate where PCR gap closure was done. (B) Comparison of the final assembly of the X. axonopodis pv. citrumelo genome (top) to the optical map (bottom) for the BamHI digestion. (C) Comparison of the finished sequence of X. axonopodis pv. citrumelo (center) to the BamHI optical map of X. axonopodis pv. citri strain 306 (top) and X. campestris pv. vesicatoria strain 85-10 (bottom). Dark blue represents cut sites, light blue represents aligned regions, red represents regions aligning to both sequences, and white represents unaligned regions. Alignment lines for inversions and translocations are highlighted in pink. Inverted and translocated regions are highlighted in yellow.

