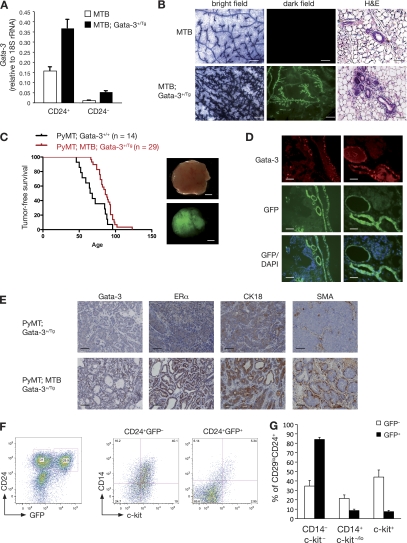
Fig. 5.
Forced expression of Gata-3 delays mammary tumor formation in MMTV-PyMT mice and induces a differentiated phenotype. (A) Quantitative RT-PCR analysis showing the expression of Gata-3 in freshly sorted CD24+ and CD24− cells from 8-week-old control mice (MTB) and inducible Gata-3 transgenic mice (MTB; Gata-3+/Tg), 4 weeks posttreatment with doxycycline. (B) Whole-mount and mammary gland sections from 7-week-old MTB and MTB; Gata-3+/Tg mice 4 weeks after treatment with doxycycline. Bright-field images show hematoxylin staining of mammary whole mounts. Dark-field images show GFP expression in mammary gland whole mounts. Scale bars, 250 μm. Hematoxylin and eosin staining section: scale bars, 50 μm. (C) Kaplan-Meier plots showing tumor-free survival of PyMT; Gata-3+/+ and PyMT; Gata-3+/Tg mice treated with doxycycline (from 4 weeks of age). Median tumor-free survival times were 66 versus 86 days, respectively (P < 0.05). Right panel: bright-field and dark-field images showing GFP expression in PyMT; MTB; Gata-3+/Tg tumor. Scale bars, 2 mm. (D) GFP expression, DAPI staining, and Gata-3 immunofluorescence staining on consecutive sections of PyMT; MTB; Gata-3+/Tg tumors. Scale bars, 50 μm. (E) Immunohistochemical staining for Gata-3, estrogen receptor α (ERα), cytokeratin 18 (CK18), and smooth muscle actin (SMA) in sections from PyMT; Gata-3+/Tg and PyMT; MTB; Gata-3+/Tg tumors. Scale bars, 50 μm. (F) FACS analysis of PyMT; MTB; Gata-3+/Tg tumors showing the expression of GFP and CD24 in Lin− cells (left panel). Right panel shows the expression of CD14 and c-kit in GFP+ and GFP− cells. (G) Histogram showing percentages of c-kit/CD14 cells in CD24+ GFP+ or CD24+ GFP− subpopulations from PyMT; MTB; Gata-3+/Tg mice (means ± SEM of results for three animals per group).

