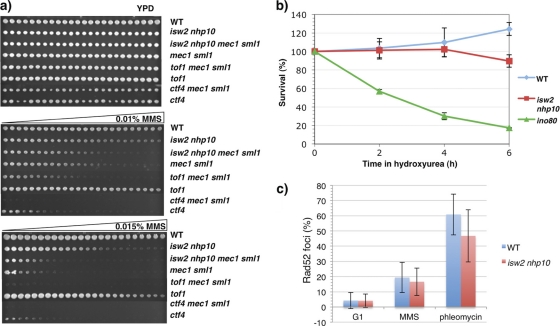
Fig. 4.
Evidence against increased replication fork troubles in isw2 nhp10 cells. (a) Spot assay for genetic-interaction test. Strains were grown to saturation and pinned on YPD plates with or without a gradient of 0.01% (vol/vol) or 0.015% (vol/vol) MMS. Plates were grown for 2 days at 30°C. (b) Viability assay following HU treatment. Percentages of surviving colonies at each time point determined relative to untreated cells are shown. Average percent survival and standard deviation (error bars) values, representing the results of three experimental replicates for WT and ino80 cells and 4 experimental replicates for isw2 nhp10 cells, are shown. (c) Quantitation of Rad52 foci after drug treatment. Cells were arrested in G1 and released into either 0.02% MMS or 6 μg/ml phleomycin for 60 min. Cells were fixed with paraformaldehyde and viewed by fluorescence microscopy. The averages and standard deviations (error bars) of the percentages of Rad52-YFP foci were determined by counting 200 cells twice each from two independent experiments.

