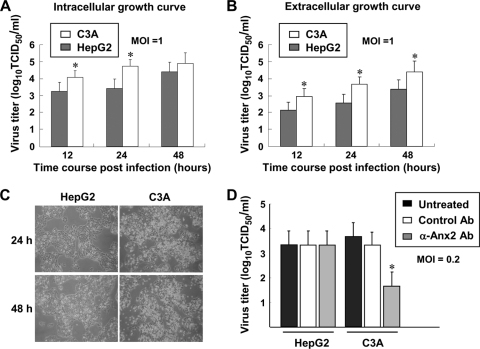
Fig. 6.
EV71 infectivity is higher in the C3A cell line than in the HepG2 cell line. (A and B) Comparison of the intracellular (A) and extracellular (B) levels of EV71 in HepG2 and C3A cells. EV71 (MOI, 1) was allowed to adsorb to 1 × 10⁵ cells for 1 h at 37°C, and unbound virus was washed away. Cells were further cultured in 2% FBS-MEM for the indicated times, and the titers of intracellular and extracellular virus at each time point were determined by a TCID50 assay. Results are means ± SE for six experiments.*, P < 0.05 for comparison with HepG2 cells. (C) Comparison of the EV71-induced CPE on HepG2 and C3A cells. Cells were infected with EV71 for 24 h or 48 h as indicated, and the resulting CPE was observed under a phase-contrast microscope. Representative panels show that EV71 infection causes a more pronounced CPE in C3A cells than in HepG2 cells. (D) Anti-Anx2 antibody blocking assay. A total of 1 × 10⁵ C3A or HepG2 cells were pretreated with an anti-Anx2 antibody or mouse IgG1 isotype control antibody at 20 μg/ml for 1 h at 37°C before being infected with EV71 (MOI, 0.2). The virus yield was determined by a TCID50 assay at 42 h postinfection. Results are means ± SE for three experiments. *, P < 0.05 for comparison with control antibody-pretreated C3A cells.

