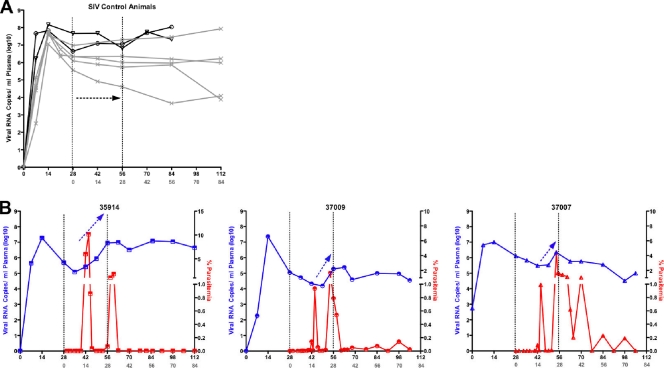
Fig. 3.
Transient increases in viremia during acute malaria. (A) Longitudinal SIV RNA levels in SIV-infected animals. Concurrent and historical SIV-infected animals are represented by black open symbols and by the gray x, respectively. (B) Temporal correlation of viral RNA (blue) and blood smear parasitemia (red) for SIV-P. fragile-coinfected animals. Note the increase in the viral RNA slope between days 42 and 56 PI-SIV (black arrows).

