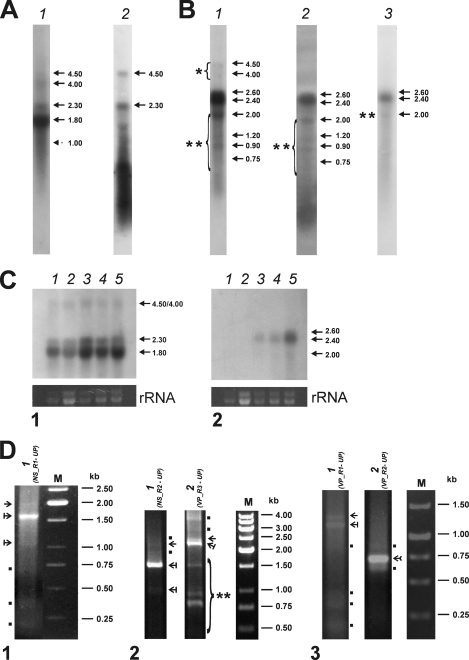
Fig. 3.
Transcription profiles of BgDNV RNAs corresponding to NS and VP ORFs. (A) Northern blot analysis of NS transcription in BGE-2 cells. The blots were hybridized with 32P-labeled DNA probes corresponding to ORF3 (pORF3) (lane 1) and ORF5 (pNS5) (lane 2). The identified transcripts are indicated by arrows with their respective sizes (kb) on the side. (B) Northern blot analysis of VP transcription. Blots were hybridized with 32P-labeled DNA probes corresponding to the whole VP-coding region (pVPwhole) (lane 1), the 5′ region of ORF2 (nt 4641 to 5096; pVPst) (lane 2), and the end of ORF1 (nt 2564 to 3465; pVPend) (lane 3). Viral RNA bands detected in each case are indicated by arrows with their respective sizes (kb) on the side. The group of additional high-molecular-mass transcripts is indicated by a bracket with one asterisk. Additional lower-molecular-mass transcripts in lanes 1 and 2 are indicated by a bracket with two asterisks, and that in lane 3 is indicated by two asterisks only. (C) Northern blot analysis of the temporal dynamics of transcription. The blots were hybridized with 32P-labeled DNA probes corresponding to NS ORFs (pORF3) (panel 1) and VP ORFs (pVPwhole) (panel 2). Both panels: lane 1, total RNA extracted from cells at 3 h p.i.; lane 2, 1 day p.i.; lane 3, 5 days p.i.; lane 4, 7 days p.i.; lane 5, 25 days p.i. The blot at the bottom of each panel demonstrates the corresponding amounts of rRNA. The identified transcripts are indicated by arrows with their respective sizes (kb) on the side. (D) RACE assay. Total RNA isolated from BgDNV-infected BGE-2 cells was used for first-strand cDNA synthesis with the poly(A) primer and a specific adapter primer as specified in Materials and Methods. The resulting products were used for PCR amplifications with gene-specific and universal primers. Above each lane, the primers used for each case are specified. Panel 1, 5′ RACE to identify NS transcription start sites. Panel 2, 3′ RACE to identify NS and VP transcription termination sites, respectively. Panel 3, 5′ RACE to identify VP transcription start sites. Lane M in each case contains molecular mass markers. Nonspecific amplification products are indicated by dots. The major viral transcripts used to determine the transcription start and end sites are indicated by arrows. cDNAs corresponding to unspliced transcripts in each case are indicated by ordinary arrows, and those for spliced transcripts are indicated by the arrows with vertical lines. cDNA corresponding to both spliced and unspliced VP transcripts in panel 3, lane 2, is indicated by a feathered arrow. The bracket with two asterisks in panel 2, lane 2 (3′ RACE), indicates additional VP transcripts discussed in the text.

