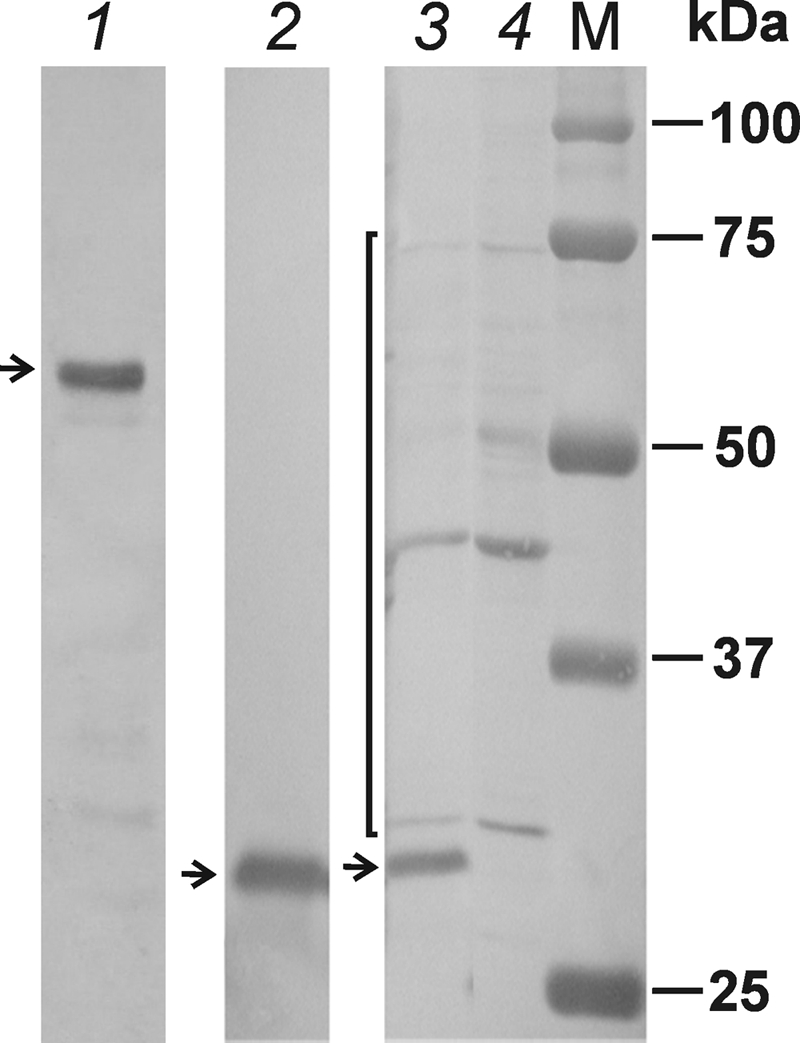
Fig. 5.

Western blot analysis of BgDNV nonstructural proteins. BGE-2 cells were infected with BgDNV and harvested, and protein extracts were obtained by boiling with SDS-PAGE loading buffer. Samples were separated by 7.5% (for NS1) or 10% (for NS2 and NS3) SDS-PAGE, electroblotted onto PVDF membranes, and probed with the respective antibodies to nonstructural proteins. Lane 1, antibodies to NS1. Lane 2, antibodies to NS2. The ∼60 kDa (NS1) and ∼29 kDa (NS2) bands are indicated by arrows. Lane 3, protein extracts from infected BGE-2 cells probed with antibodies to NS3. Lane 4, protein extracts from control, uninfected cells probed with the same antibodies. The band corresponding to NS3 (∼30 kDa) is indicated by an arrow. Nonspecific band are indicated by a bracket. M, protein molecular mass markers (in kilodaltons).
