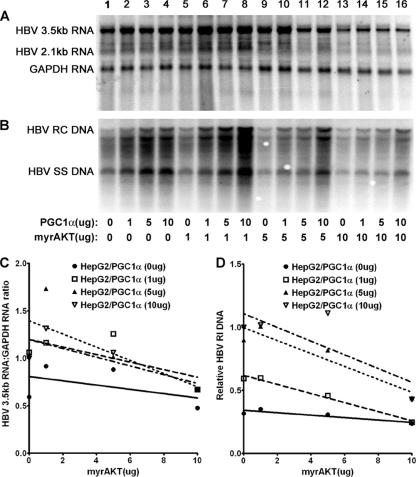
Fig. 4.
Effect of PGC1α and AKT expression on HBV biosynthesis in the human hepatoma cell line HepG2. Cells were transfected with the HBV DNA (4.1-kbp) construct alone (lane 1) or the HBV DNA (4.1-kbp) construct plus the PGC1α and AKT expression vectors (lanes 2 to 16), as indicated. (A) RNA (Northern) filter hybridization analysis of HBV transcripts. The glyceraldehyde-3-phosphate dehydrogenase (GAPDH) transcript was used as an internal control for RNA loading per lane. (B) DNA (Southern) filter hybridization analysis of HBV replication intermediates. HBV RC DNA, HBV relaxed circular DNA; HBV SS DNA, HBV single-stranded DNA. (C) Quantitative analysis of the HBV 3.5-kb RNA from four independent experiments. Trend lines were calculated using one-phase decay analysis and the method of least-squares fit (GraphPad Prism, version 5, software). (D) Quantitative analysis of the HBV replication intermediates from four independent experiments. Trend lines were calculated using one-phase decay analysis and the method of least-squares fit (GraphPad Prism, version 5, software).

