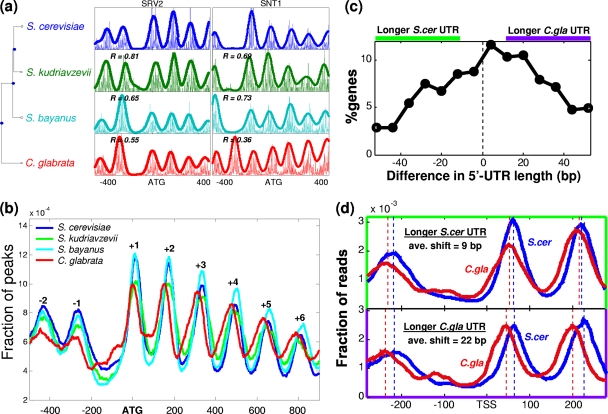
Fig. 1.
Patterns of nucleosome positioning of four yeast species. (a) Phylogenetic tree and examples of two orthologous loci. At each locus, the density of reads is shown along with a smoothed pattern (nucleosome positioning score). The correlation between nucleosome score patterns of S. cerevisiae and each of the other species is also indicated for each gene. (b) Distribution of peaks in nucleosome positioning scores relative to their ATG, over all genes analyzed in each species (see Table S1 in the supplemental material). (c) Distribution of differences in 5′ UTR lengths between S. cerevisiae and C. glabrata orthologs. The regions with larger 5′ UTRs in C. glabrata and S. cerevisiae (by at least 10 bp) are marked above the graph, and the corresponding genes are used in panel d. (d) Normalized read density relative to the TSS of S. cerevisiae and C. glabrata orthologs. Genes with longer UTRs (by at least 10 bp, as shown in panel c) in S. cerevisiae and C. glabrata are shown, along with the corresponding peaks of read densities (dotted lines) and the average shift of the peaks.

