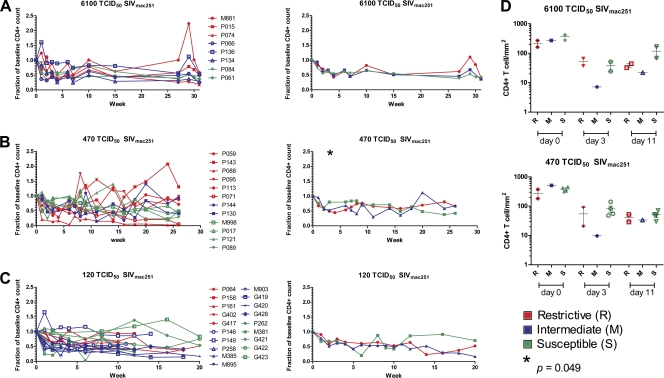
Fig. 2.
CD4+ T cell count in blood and rectal mucosa in control rhesus macaques. (A) Fraction of baseline of CD4+ T cell in the blood from eight animals challenged with a single 6,100 TCID50 of SIVmac251 dose in the left panel. The right panel shows the averages of the three R, three M, and two S animals. The relative CD4+ T cell count of animals challenged with two doses of 470 (B) or 120 TCID50 of SIVmac251 (C) are depicted in the left panels, whereas the averages of the R and S animals are shown in the right panels, respectively. (D) The count of CD4+ T cell was evaluated at 0, 3, and 11 weeks from the SIVmac251 challenge in the rectal mucosa from control animals exposed to 6,100 TCID50 (upper panel) and 470 TCID50 of SIVmac251 (lower panel). R animals are marked in red, M animals are marked in blue, and S animals are marked in green.

