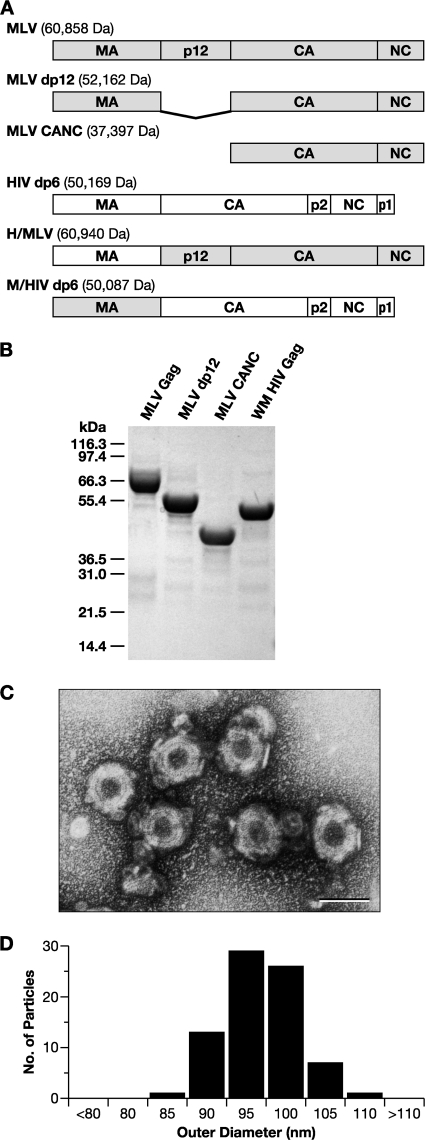
Fig. 1.
(A) Schematic representation and molecular masses of the Gag proteins in the present study, showing domain organization. (B) SDS-PAGE gel of purified Gag proteins, stained with Coomassie brilliant blue. WM HIV-1 Gag, a monomeric mutant of HIV-1 Gag, is included. (C) Negative stain EM of VLPs assembled from MLV Gag in vitro. Scale bar, 100 nm. (D) Histogram of the size distribution of in vitro assembled MLV Gag VLPs.

