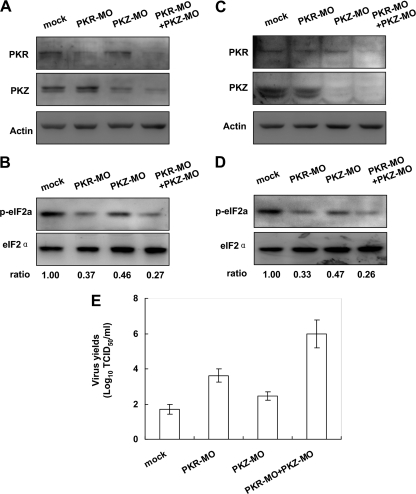
Fig. 6.
Effects on GCRV replication by knockdown of PKR or PKZ. (A and B) CAB cells seeded in 24-well plates were delivered with control MO (mock), PKR-MO, PKZ-MO, or PKR-MO plus PKZ-MO (detailed in Materials and Methods) and induced by rIFN at 20 ng/ml for 12 h and subjected to immunoblot analysis. (C to E) The other group of MO-delivered cells were subjected to GCRV infection (each well with 1 ml of a solution with 200 TCID50/ml) for 48 h. While the cells were subjected to Western blot analysis (C and D), the supernatants were collected for detection of virus titers by TCID50 assays (E). The relative levels of eIF2α phosphorylation as determined by quantitative densitometry are shown below the blots in panels B and D.

