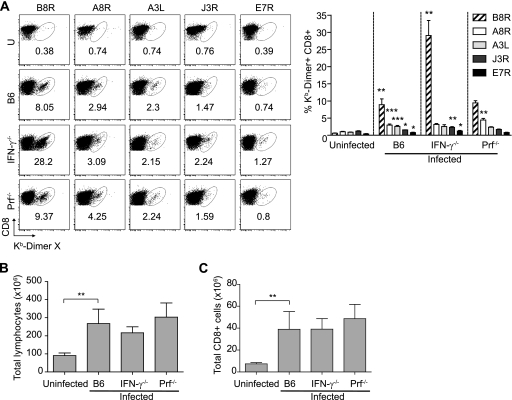
Fig. 2.
Increased number of anti-VACV CD8+ T cell responses to acute VACV in IFN-γ−/− but not in Prf−/− mice. B6, IFN-γ−/−, and Prf−/− mice were infected with 106 PFU VACV i.p., and at 7 dpi, individual spleens were collected and processed, and total lymphocytes were counted and analyzed. (A) (Left) Representative flow cytometry plots show the percentages of DimerX staining. U, uninfected. (Right) Bar graphs show summary data for the percentages of DimerX staining for five individual mice. (B) Total lymphocyte numbers. (C) The number of total CD8+ cells increases in infected mice. Data are means for five mice per group ± SEM (four IFN-γ−/− mice, because one died 7 dpi) and are representative of three independent experiments. Asterisks for infected B6 mice represent P values for comparisons to uninfected B6 mice. Asterisks for IFN-γ−/− and Prf−/− mice represent P values for comparisons to infected B6 mice. *, P = 0.05; **, P = 0.01; ***, P = 0.001.

