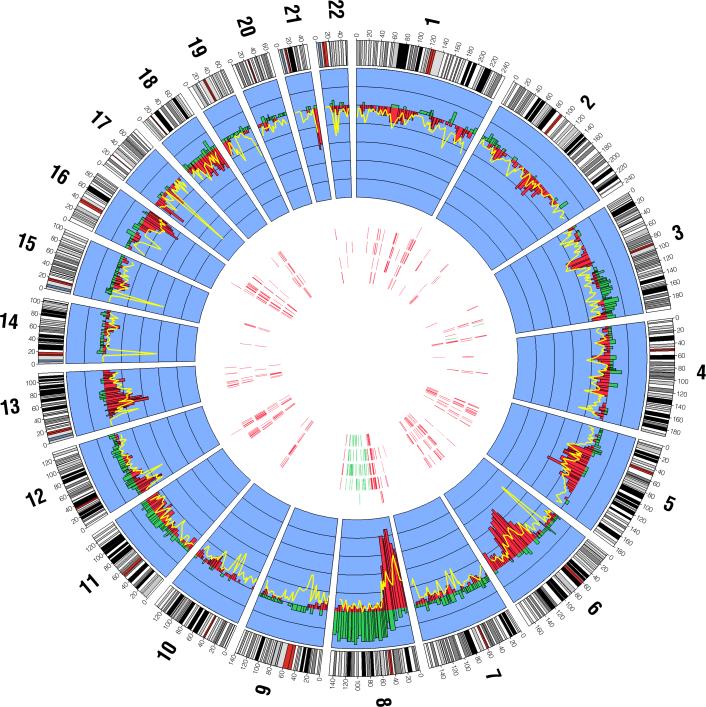
Figure 1.
The genome-wide distribution of CNA gains, losses, and copy-neutral events (loss of one allele and duplication of the second allele) among 62 prostate cancer cases. The inner blue band displays the proportion of CNA gains and losses for each cytological band as histograms across each chromosome. Gains are displayed in green and losses are displayed in red. Within the inner blue band, the distance between each black line corresponds to 0.1 units (i.e. 10%), and the black line where the gain and loss histograms radiate from corresponds to zero. The proportion of copy neutral events at each cytological band is displayed by a yellow line overlying the loss histograms. Within the interior portion of the figure, each of the five concentric bands corresponds to the top five GO biological process terms disrupted in the 62 tumors (arranged outward in: 1. defense response to bacterium, 2. regulation of apoptosis, 3. response to organic substance, 3. cell-cell signaling, 4. protein complex assembly). The vertical marks within each band correspond to the chromosome and base-pair locations of genes disrupted in each of the pathways in > 5% (4 or more) tumors, where the green marks indicates a gene that is predominantly gained and a red mark indicates a gene that is predominantly lost (either copy loss or copy neutral loss).

