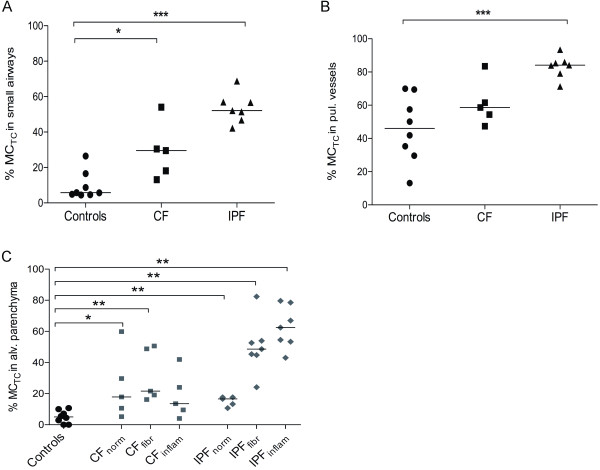
Figure 5.
The proportion of MCTC and MCT, expressed as the percentage of MCTC, in anatomical lung compartments in never-smoking controls and patients with CF and IPF. Data are presented for small airways (A), pulmonary vessels (B), and alveolar parenchyma (C). Data are presented as scatter plots, where horizontal lines denote median values. Statistical differences to never-smoking controls were analysed using Mann-Whitney and asterisks show significant difference where * denotes p < 0.05, ** < 0.01, and *** p < 0.001.

