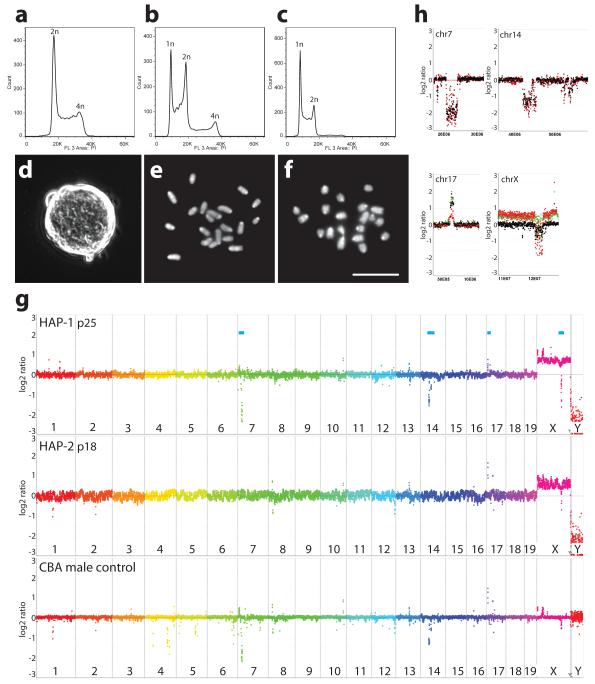
Figure 1. Derivation of haploid ESCs.
Flow analysis of DNA after PI staining of (a) diploid control ESCs, (b) haploid ESC line HAP-1 at passage 7 (p7) and (c) HAP-1 (p11) after sorting at p7. (d) Colony morphology of haploid ESCs (HAP-1). (ef) Chromosome spreads of HAP-3 (e) and HAP-1 (f), (Scale bar = 10 μm). (g) CGH analysis of HAP-1 and HAP-2 ESCs and control male CBA kidney DNA. Relative copynumber is plotted at 200 kb resolution using a log2 scale. Genomic positions indicated by blue bars (top) are enlarged at 40 kb resolution in (h); CBA control (black), HAP-1 (red) and HAP-2 (green).

