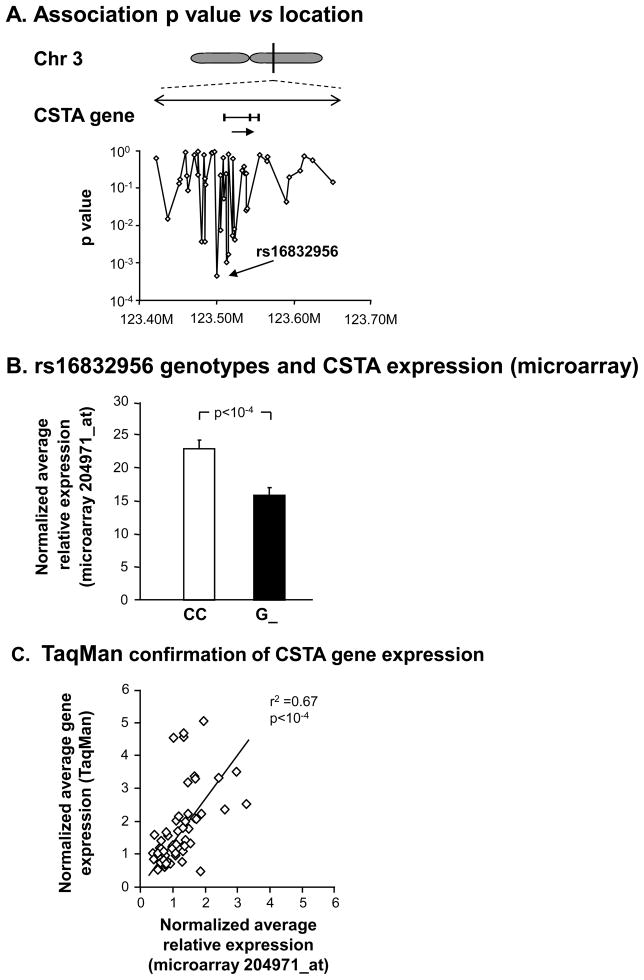
Figure 1.
Genetic modulation of CSTA SAE gene expression. A. Magnified view of the CSTA gene region, with direction of transcription (arrow). Below the gene, same scale, are the corresponding chromosomal locations of 48 cis-SNPs on the Affymetrix Human SNP Array 5.0 found within 100 kb either side of the gene. Shown are the correlations (Wald statistic) with microarray-assessed SAECSTA gene expression in 112 healthy nonsmokers, healthy smokers, and smokers with COPD. B. Microarray normalized average expression values of CSTA for genotypes of SNP rs16832956. Shown are data for all 112 genotyped subjects with CSTA SAE gene expression on the ordinate. G_=data for the combined genotypes GG and CG. C. TaqMan RT-PCR confirmation of microarray CSTA gene expression levels in SAE in a random subset of healthy nonsmokers (n=23), healthy smokers (n=28), and COPD smokers (n=13).

