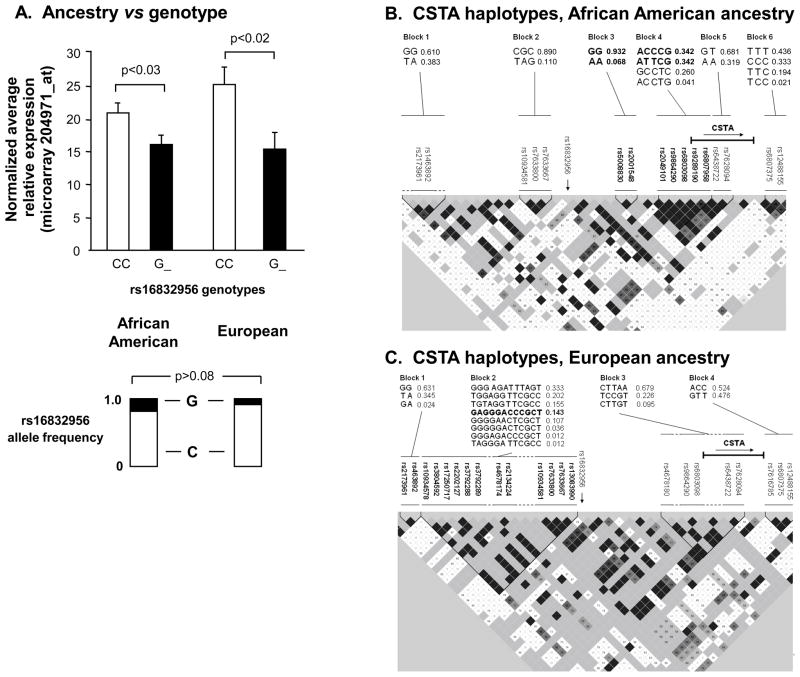
Figure 2.
Effect of ancestry on genetic modulation of SAECSTA expression. A. CSTA expression based on genotypes of rs16832956 parsed by the 2 major ancestral groups, African American and European. Ordinate -normalized average relative CSTA gene expression. Allele frequencies as shown. B. Analysis of haplotypes derived from local CSTA cis-genotypes in subjects of African American genetic ancestry. Analyses performed on the subset of 56 subjects of African American ancestry with available genotype data. The genomic sequence and frequencies of the 6 haplotype blocks are shown in the upper portion of the figure, corresponding to the named SNPs indicated below. In the haplotype map, the darker the shading, the stronger the linkage disequilibrium (LD) between adjacent SNPs, and vice versa. The haplotypes in blocks 3 and 4 (highlighted in bold type, with the highlighted constituent SNPs shown beneath), were significantly associated with CSTA gene expression (see Supplementary Table II). The relative location and direction of the CSTA gene is indicated. The relative location of the SNP most strongly associated with CSTA gene expression, rs16832956, is indicated (vertical arrow). C. CSTA haplotype association data for 35 subjects of European genetic ancestry. The indicated haplotype in block 2, composed of the 12 SNPs shown in bold, was the only haplotype significantly associated with CSTA gene expression (see Supplementary Table II).

