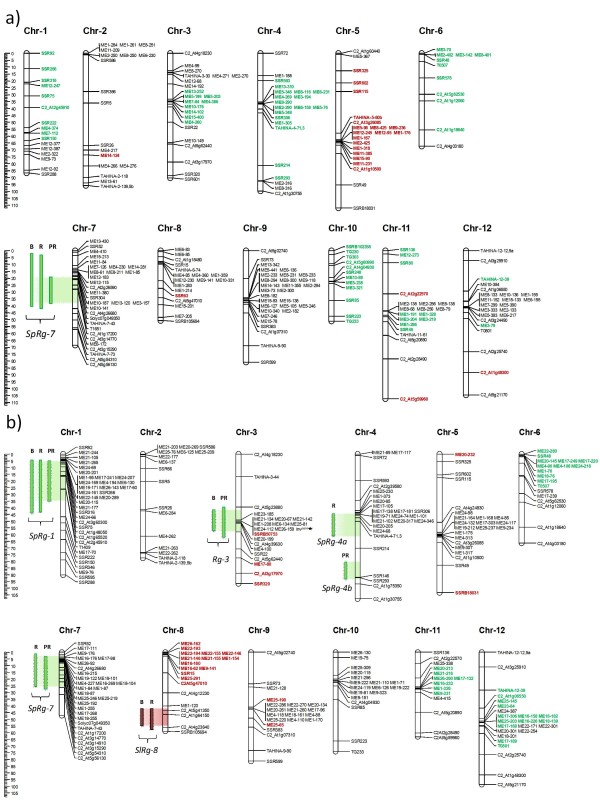
Figure 2.
a) Tomato genetic linkage map of F2 population derived from S. lycopersicum (cv. Anl27) × S. pennellii (PE-47) and QTLs detected for regeneration traits by IM. b) Tomato genetic linkage map of BC1 population derived from S. lycopersicum (cv. Anl27) × F1 (cv. Anl27 × PE-47) and QTLs detected for regeneration traits by rMQM. The segregated data were classified into 12 linkage groups, which corresponded to the Tomato-EXPEN 2000 map; italics indicate markers with segregation significantly skewed (P < 0.05) in favour of parent alleles. The colors specify the direction of the segregation distortion (red: markers skewed toward the alleles of cultivated tomato; green: markers skewed toward the alleles of the wild parent). Green bars reflect QTLs from S. pennellii: SpRg-1, Rg-3, SpRg-4a, SpRg-4b and SpRg-7; the red bar reflects the SlRg-8 QTL from S. lycopersicum. Regeneration traits: B (Bud percentage), R (Regeneration percentage) and PR (Productivity rate). The black star labels the acid invertase gene (invpenn) mapped on chromosome 3 included in the Rg-3 QTL range.

