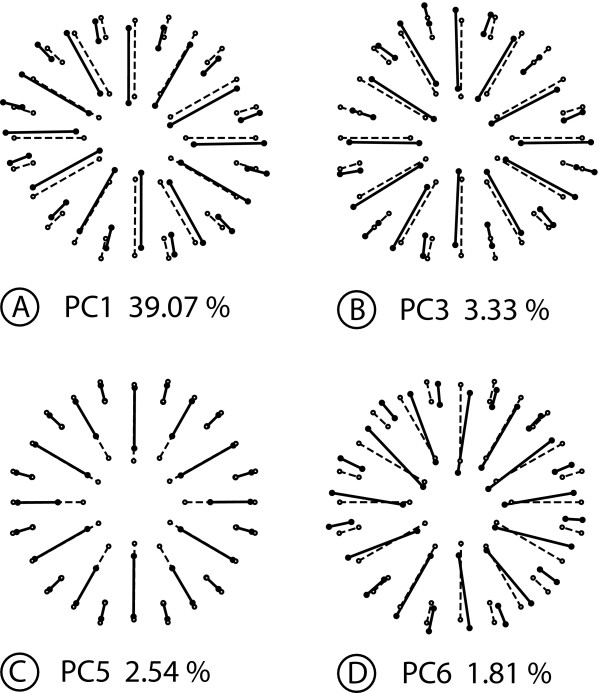
Figure 7.
Analysis 2: Decomposition of shape variation for symmetry with respect to rotation of order 6. This figure shows examples of PCs that account for the maximum of variance for each category of shape variation. Each diagram shows the symmetric consensus (open circles and dotted lines) and the differences between the consensus and the other configuration (solid circles and solid lines) represent the shape change associated with the respective PC by an arbitrary amount of + 0.1 units of Procrustes distance. The percentages represent the part of the total shape variation for which each PC accounts. A. Asymmetric component, symmetric under rotation of order 2. B. Asymmetric component, symmetric under rotation of order 3. C. Symmetric component. D. Totally asymmetric component.

