
Figure 1.
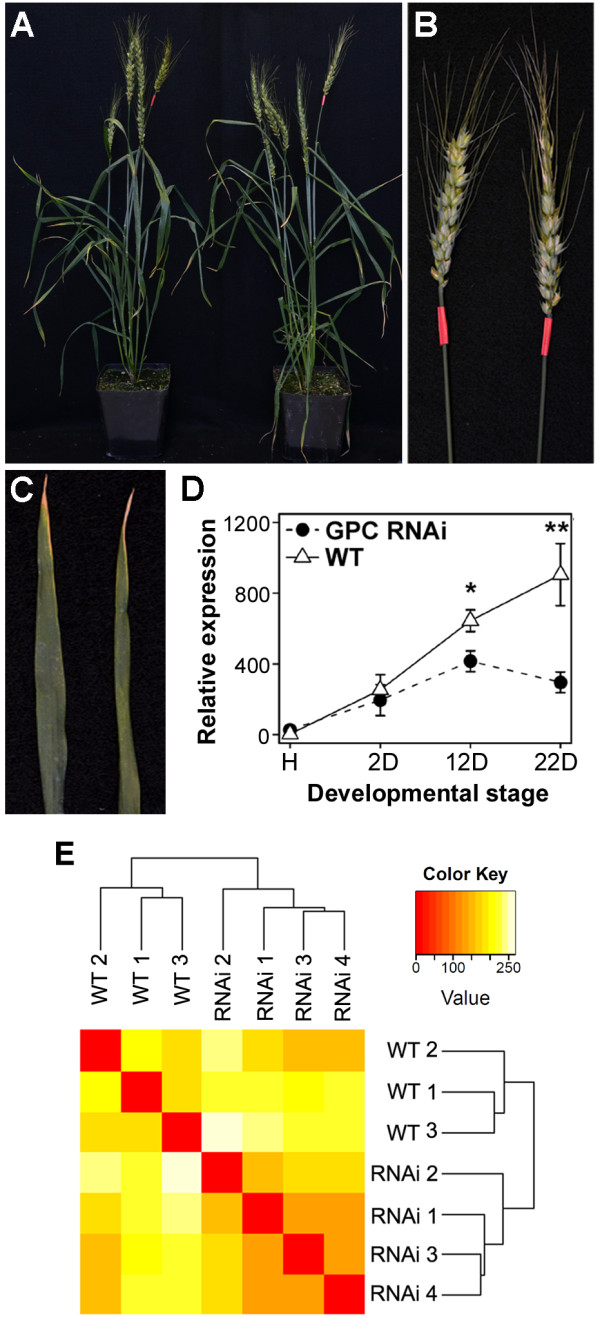
WT and GPC-RNAi plants 12 days after anthesis. (A) WT (left) and GPC-RNAi plants at 12 DAA used to analyze the GPC-dependent transcriptional changes. (B & C) Close-up images of the ears (B) and flag leaves (C) from WT (left) and GPC-RNAi plants (right) at 12 DAA. (D) Expression profile of the GPC genes relative to ACTIN in WT and GPC-RNAi plants across a senescing leaf time course (H = heading, D = days after anthesis). Transcript levels are presented as normalized, linearized values from 10 biological replicates (± SEM) derived from the 2-ΔΔCt method [36], where Ct is the threshold cycle. * P≤0.05, ** P≤0.01. (E) Sample clustering based on counts of Illumina reads mapped on 454 contigs. Dendrogram represents the hierarchical clustering of samples as determined by Euclidean distance. The heat map shows a false color representation of the Euclidean distance matrix (from red for zero distance to white for large distance).