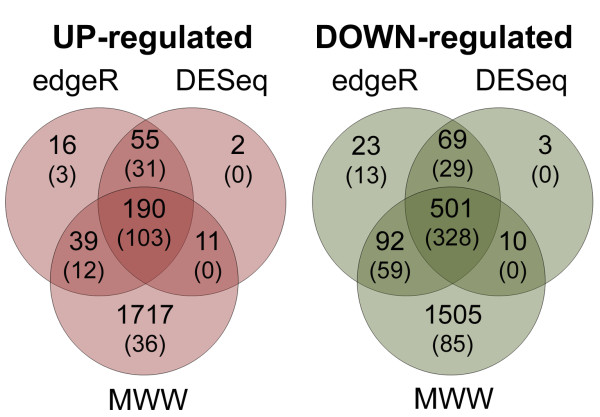
Figure 3.
Comparison of sets of differentially regulated isogroups identified by different statistical testing approaches. Venn diagrams show the overlapping and unique sets of significantly up-regulated and down-regulated isogroups identify by Mann-Whitney-Wilcoxon (MWW) test or by the R/Bioconductor software packages edgeR and DESeq. Values in parentheses denote isogroups with a ≥ 2 fold differential expression.

