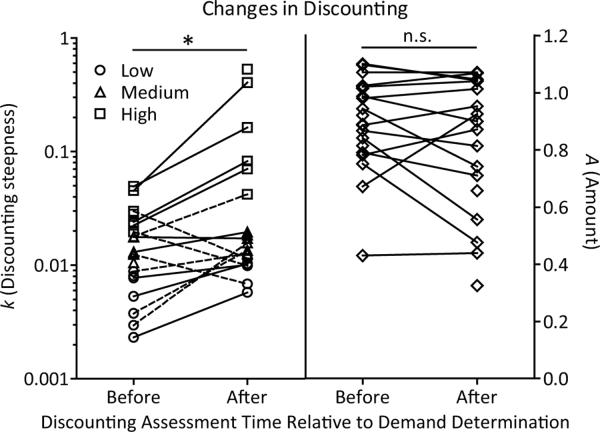
Figure 4.
Changes in discounting parameters from the initial discounting assessment to the discounting reassessment. The shapes of the symbols in the left panel indicate the group subject was placed into for the initial assessment before demand evaluation and the reassessment after demand evaluation. Solid lines connect points for a single subject when that subject stayed in the same group, while dotted lines connect points for subjects that switched groups from one assessment to the next. The results of statistical comparisons between time points are also shown (* p < .05; n.s. = not significant).

