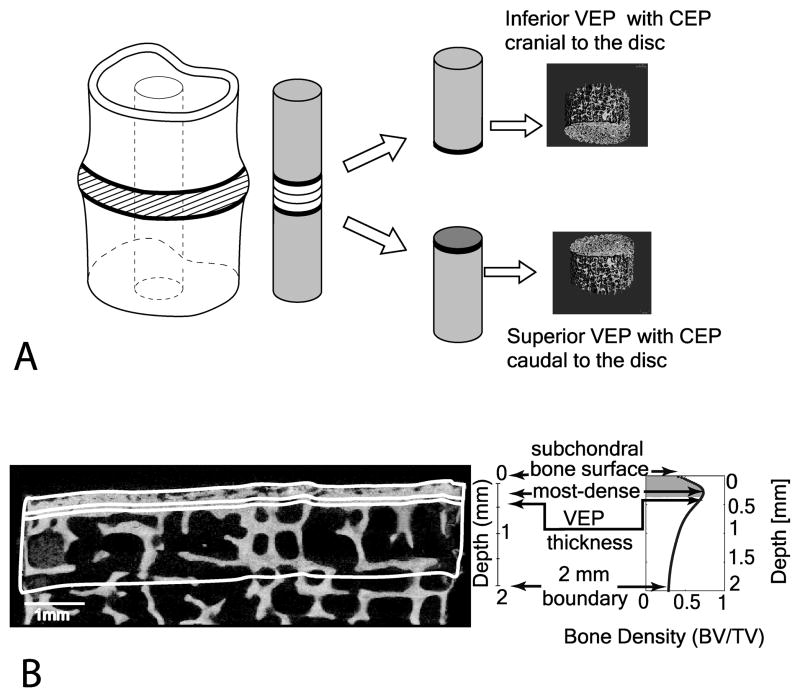
Figure 1.
(A) (From left to right). The diagram shows the cylindrical core obtained from the vertebral motion segment. It is followed by a 3D MicroCT image of the two individual vertebral cores highlighting the location of the 2 mm regions. From the surface, a 2 mm thick region was selected. (B) A sagittal binarized image of a subchondral bone section with a 2 mm ROI was selected (bottom left). A plot of the bone volume fraction (BV/TV) variation through the 2 mm depth is shown on the right. The location of the four ROIs analyzed was matched visually with the sagittal image on the left (bottom right).

