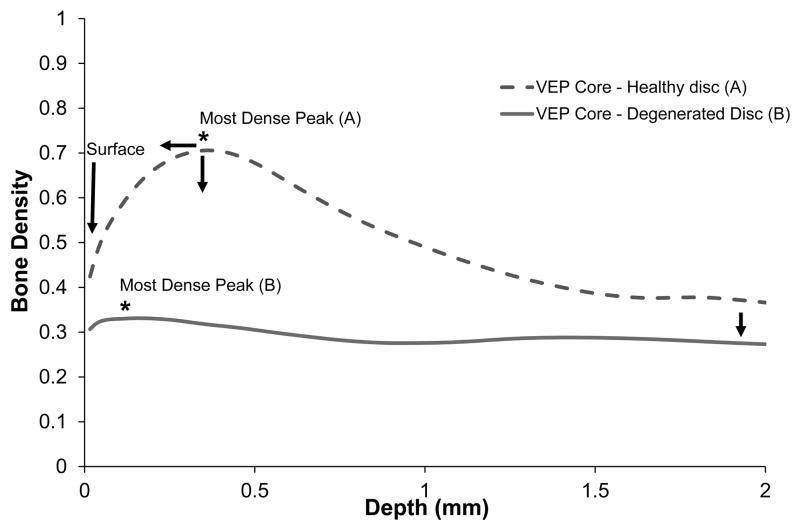
Figure 6.
Degeneration changes from two representative vertebral cores: (A) adjacent to a healthy disc and (B) adjacent to a degenerative disc, are illustrated showing a bone density variation in 2 mm depth. As the disc adjacent to a vertebral endplate became more degenerated (sample B). The most-dense peak moved closer to the surface and the bone density decreased with degeneration. The quantity of trabeculae below the transitional zone (most dense peak) also decreased as the disc became more degenerated.

