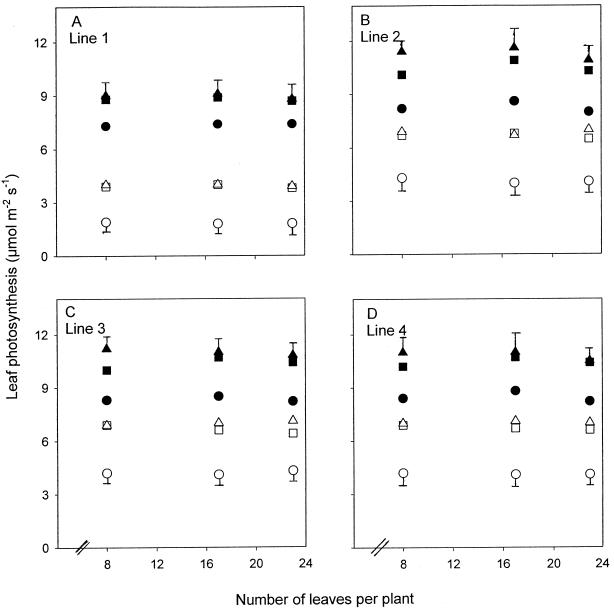
Figure 4.
Leaf photosynthesis in lines 1 (A), 2 (B), 3 (C), and 4 (D) grown at high N (•, ▪, ▴) and low N (○, □, ▵). Points are means of four replicates from the most recently fully expanded leaves (▪, □), two leaves below these leaves (old leaves; •, ○), and two leaves above these leaves (young leaves; ▴, ▵). Error bars represent the maximum se of the different-aged leaves. .

