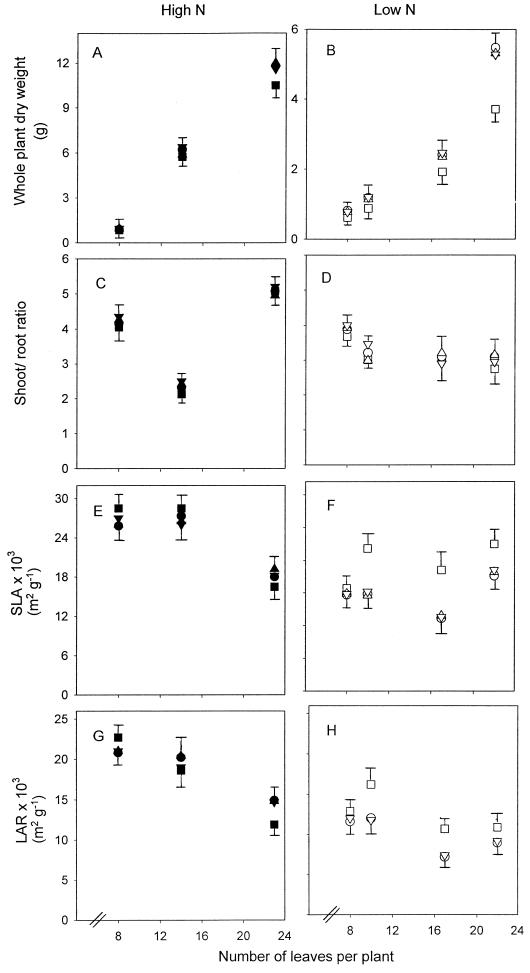
Figure 6.
Growth parameters of plants grown at high N (▪, ▴, ▾, •) and low N (□, ▵, ▿, ○) in lines 1 (▪, □), 2 (▴, ▵), 3 (▾, ▿), and 4 (•, ○). Whole-plant dry weight (A and B), shoot-to-root ratio (C and D), SLA (leaf area per unit leaf dry weight; E and F), and LAR (leaf area per whole-plant dry weight; G and H). Error bars represent the maximum se of all of the lines except for whole-plant dry weight, SLA, and LAR at low N, for which the se of line 1 is also shown.

