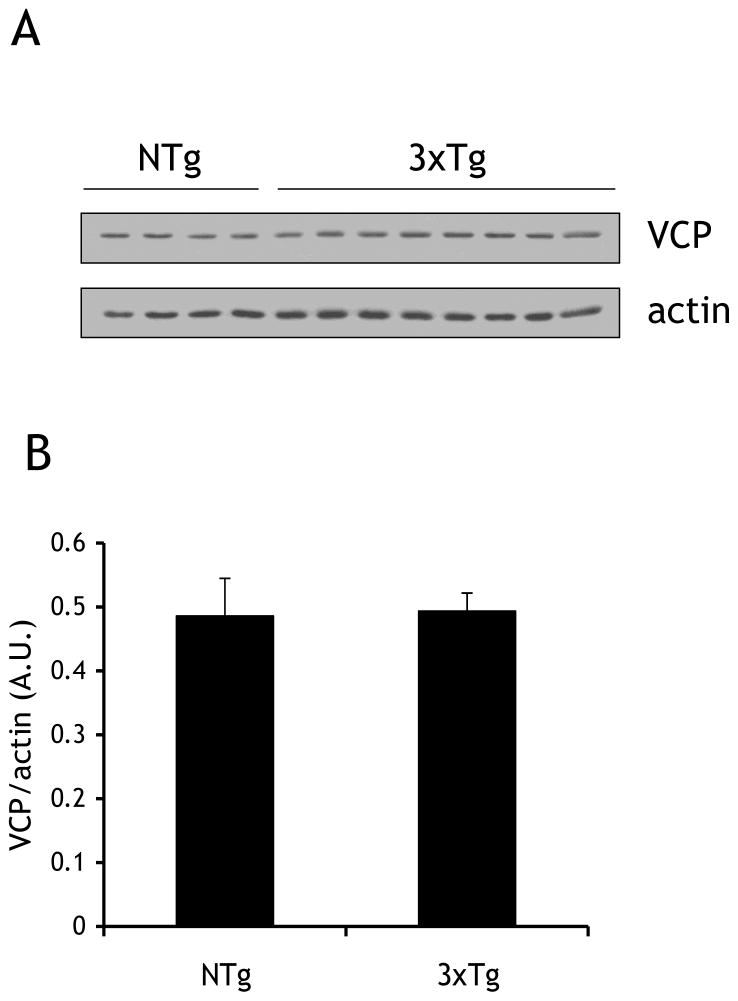
Fig 2. VCP levels in the cortex of 3xTg-AD and NTg mice are similar.
(A) Cortical tissue samples from 4 non-transgenic (NTg) (26 months) and 8 triple transgenic (3xTg) (13–22 months) were processed identically to human tissue in Fig. 1. Lysates were immunoblotted for VCP and actin. (B) Quantification of immunoblotting described in (A), protein levels were quantified by scanning densitometry, normalized to actin, and expressed as arbitrary units (A.U.). There was no significant difference between the two groups.

