
Figure 2.
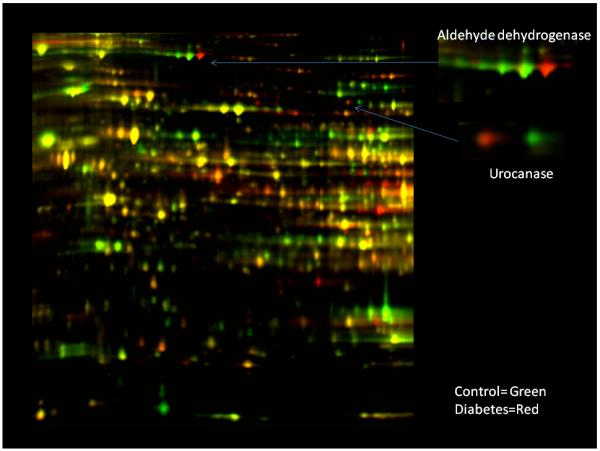
2D-DIGE of whole rat liver tissue extract from control and Type 1 Diabetic rats from Johnson et al (Johnson et al. 2008). The inserts are simply zoomed regions indicated by the arrows that represent regions where isoelectric shifts occurred. Experimental details along with protein identification are found in the original literature source.