
Figure 3.
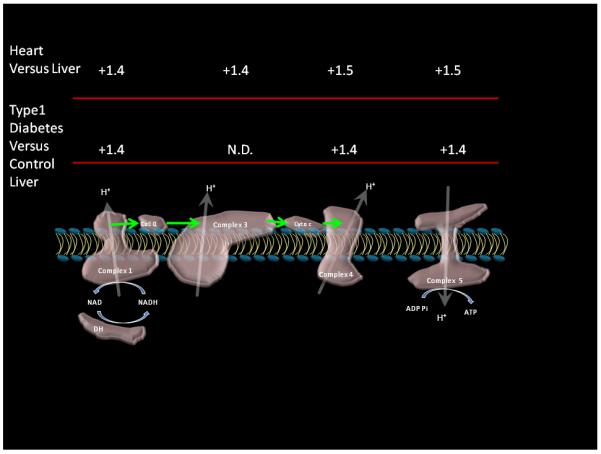
Relative changes in oxidative phosphorylation Complexes content between tissues and in the diabetic liver. Porcine liver and heart data as reported by Johnson et al (Johnson et al. 2007b). Diabetes data is from matched controls of rat liver under diabetic and control conditions (Johnson et al. 2008). Data were derived from the means of experimental data taking the mean difference of all of the subunits detected within a given complex. Complex 3 was not detected in the diabetes study that was on whole tissue decreasing the sensitivity to mitochondrial proteins.