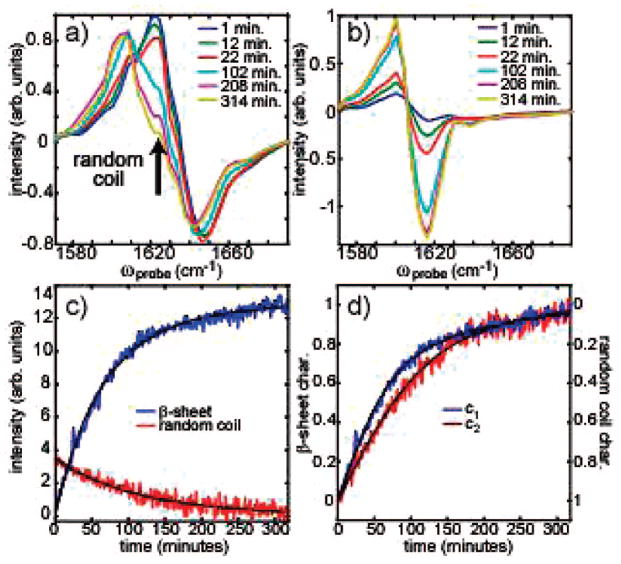
Figure 2.
(a,b) Slices taken through the 2D-IR spectra for ωpump = 1618 and 1644 cm−1, respectively. (c) The absolute intensity of the antisymmetric β-sheet feature is plotted against the absolute intensity of the random coil, sequence band feature (red arrow, panel a) for aggregation at 295 K. (d) Intensities from the two-component fits are plotted as a function of time.

