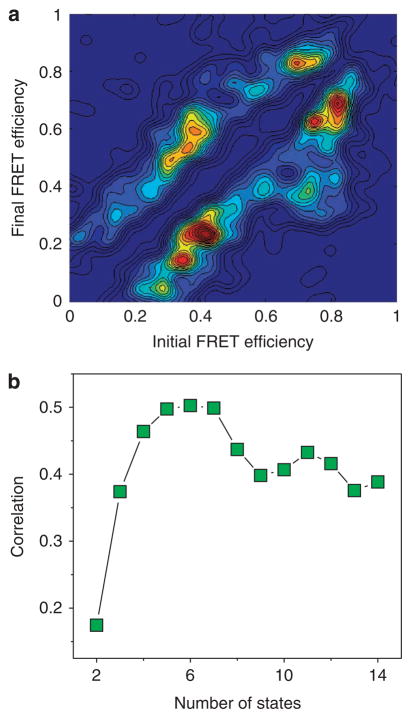
Figure 3. Transitions between multiple states in single-molecule trajectories.
(a) Transition density map constructed from the 0.65 M GdmCl data set. The map is a two-dimensional density plot of transitions identified by the change-point algorithm, as a function of initial and final FRET efficiencies for each transition. Note the strong deviation of the transition map from that expected for a two-state folder, which should include only two major peaks. (b) Correlation between the transition density map based on change-point analysis and maps based on the HMM analysis with an increasing number of states. The optimal number of states is found to be 5–7.

