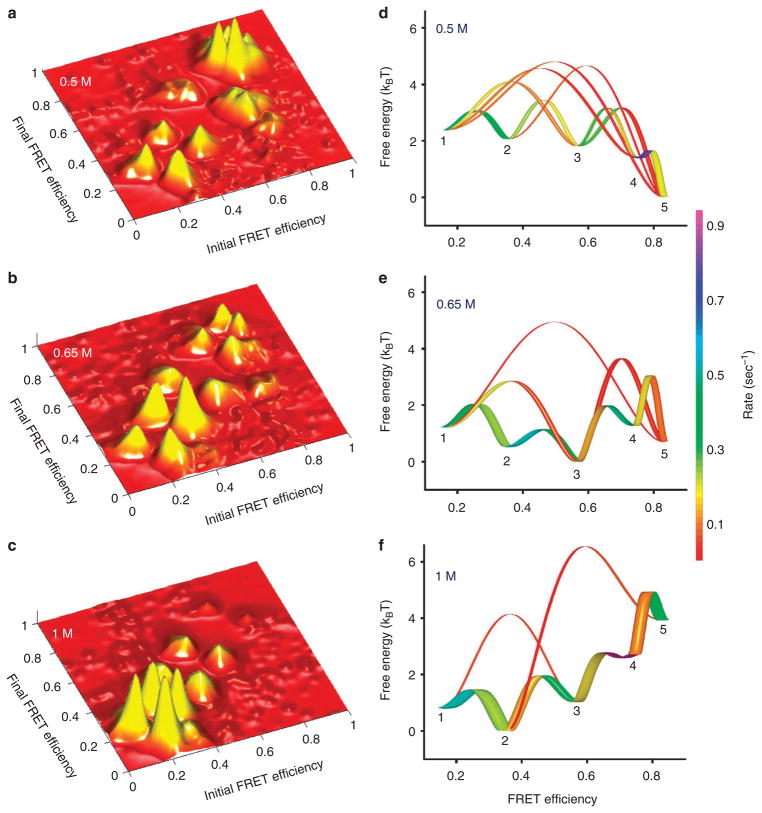
Figure 5. The folding landscape of AK.
(a–c) Transition maps at three indicated GdmCl concentrations, constructed from the experimental data using HMM analysis results. As the concentration of denaturant increases, more transitions tend to occur between states of lower FRET efficiency. In addition, the fraction of sequential transitions of the type i→i ± 1 increases significantly. (d–f) One-dimensional projections of the folding landscape of AK at the three indicated GdmCl concentrations. State 6, which is poorly connected to state 5, is not shown. The relative free energy of each state was extracted from the probability distributions of Figure 4. The heights of the free energy barriers between pairs of states were calculated from the HMM transition probability matrices (the value of the pre-exponential factor in the Arrhenius equation was set to 1). Line widths depict the relative productive flux flowing between each pair of states, whereas the colours depict the rate of each transition, according to the scale shown on the right. Only transitions that carry at least 10% of the flux from state 5 to state 1 (or vice versa) are shown.

