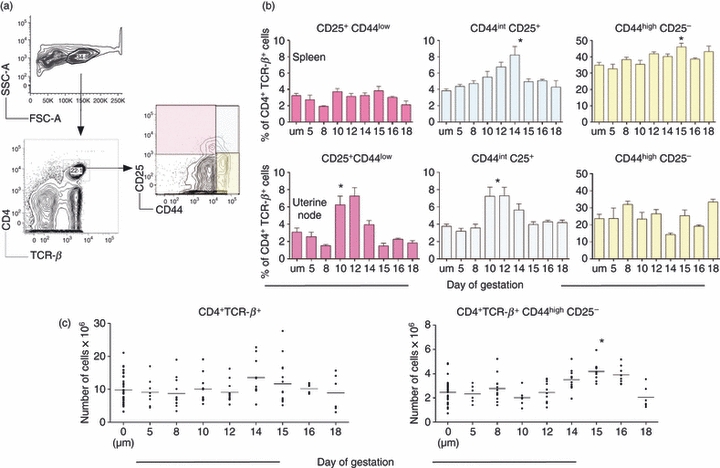
Figure 1.

Analysis of CD4 T cells during pregnancy in normal mice. C57BL/6 females were either left naive or mated with same-strain males and euthanized on various days of pregnancy to harvest, analyse and enumerate CD4+ T cells. (a) Example of flow cytometric analysis. Pink quadrant: CD25+ CD44low. Blue quadrant: CD44 intermediate CD25+. Yellow quadrant: CD44high CD25−. (b) Comparison of spleen and uterine draining node CD4+ T cells. Upper panels: spleen. Lower panels: uterine draining nodes. y-Axis: percentage of CD4+ T cell receptor β (TCR-β)+ cells; x-axis: gestational age where ‘um’ denotes unmated mice. Pink bars: percentage of cells falling in pink quadrant by flow cytometry. Blue bars: percentage of cells falling in the blue quadrant. Yellow bars: percentage of cells falling in the yellow quadrant. Each bar represents the mean (± standard error of the mean) of at least five mice. Analysis of the data was performed by Kruskal–Wallis test followed by Dunn's multiple comparisons test. Asterisk: P < 0·05. (c) Enumeration of cells in the spleen. y-Axis: number of cells; x-axis: gestational age; ‘um’ denotes unmated mice. Each symbol represents one mouse. Left: CD4+ TCR-β+ cells. Right: CD4+ TCR+ CD44high CD25− cells. Analysis of the data was performed by Kruskal–Wallis test followed by Dunn's multiple comparisons test. Asterisk: P < 0·05.
