Figure 6.

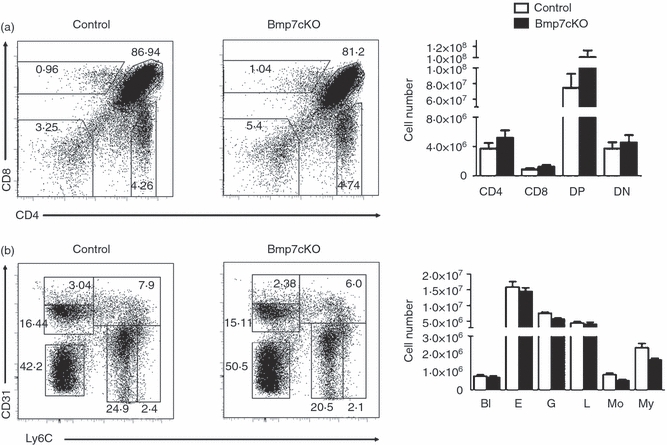
Normal lineage distribution in Bmp7cKO mice in thymus and bone marrow. Analysis of thymocyte (a) and bone marrow (b) subpopulations and graphical representation of cell numbers from Bmp7cKO and littermate control mice. (n = 4 mice per group). The results are representative for more than three independent experiments. (a) Thymocyte populations were detected by CD4/CD8 staining and gated as double-negative (DN), double-positive (DP), CD4 single-positive (SP), CD8 SP subpopulations. (b) Bone marrow populations were detected by CD31/Ly6C staining.55 Percentages and total numbers of the various subsets were unaltered (n = 4 mice per group). The results are representative for more than three independent experiments. Bl, blast-like cells; L, lymphocytes; E, erythrocytes; My, myeloid precursor cells; G, granulocytes; Mo, monocytes.
