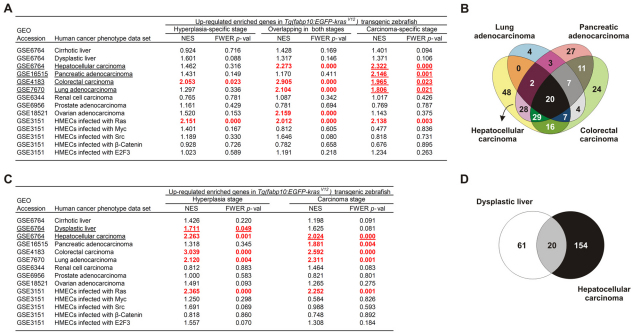
Fig. 7.
GSEA identification of conserved gene signatures common between zebrafish and human HCC. (A) Cross-species GSEA comparisons of different human cancer transcriptomic profiles with zebrafish upregulated hyperplasia-specific, carcinoma-specific and overlapping enriched genes. Human cancer data sets were collected from the Gene Expression Omnibus (GEO) database and their access numbers are indicated. Positive normalized enrichment score (NES) indicated enrichment of the zebrafish enriched genes in the human tumor state. Results shown in red were statistically significant with family-wise error rate (FWER) P-value =0.05. Significantly matched human data sets are underlined and used for gene signature identification by overlapping the zebrafish upregulated carcinoma-specific enriched genes that were found associated with each human data set. (B) Venn diagram illustrating the identification of 48 genes specific to HCC in both human and zebrafish. The 48 genes are presented in supplementary material Table S5. Lists of zebrafish enriched genes in each significant human cancer data set used to identify HCC gene signature are shown in supplementary material Table S4. (C) The stage-specific and overlapping enriched genes in zebrafish hyperplasia and carcinoma used in cross-species GSEA comparisons with different human cancer transcriptomic profiles. (D) Venn diagram identification of 20 genes upregulated during tumor progression from hyperplasia/dysplasia to carcinoma in both zebrafish and human liver cancer. These genes are presented in supplementary material Table S8, representing the liver cancer progression gene signature. Lists of zebrafish enriched genes in each significant human cancer data set used to identify the gene signature are shown in supplementary material Tables S6 and S7.

